E852 experiment
Analysis of Eta Pi0
system with the decay Eta -> Pi+ Pi- Pi0
********************************************
Draft 4
Date:
Thu, 16 Mar 2006,
From: Neal
Hi all:
I have two "physics" questions regarding the paper.
1.) I don't know if using the "average error matrix" is the right thing
to do in the mass dependent fit. This I believe leads to a (perhaps)
significant underestimate of the errors. This is due to the fact that
the ambiguous solutions have a larger spread than the typical error bar
on one of the solutions. In the eta pi- paper, we increased the error
bars for the MDF to be large enough to encompass all of the ambiguous
solutions. Shouldn't we do that here as well?
Response
We have no the final conclusion on this item.
But my opinion is to use "average error matrix" in MDF.
Such approach = average solutions + average error matrix is more
consistent and logical. Beside that we calculate the systematic errors,
which include the soluton larger spread .
2.) Now that we know the angular distribution of the background,
shouldn't we constrain the background in the fit to this distribution
instead of making it be isotropic? It would be useful to see the
scatterplot of costheta vs. phi for the background region.
Response
See please our response on comments on draft3
http://lav01.sinp.msu.ru/~vlk/E852etapiz/Adams_trc_response.html
Here we show scatterplot of costheta vs. phi for the background region.
We pay attention that our statistic in background region is very small.
We can't to calculate robust angular distributions in 40 MeV mass bin.
So we use 1.14-1.42 MeV of EtaPi0 mass for side bands near Eta sygnal.
Our estimation of anisotropy in background region is 15% -25%.
***************************************************************
Date:
Fri, 24 Mar 2006
From: Neal
Hi all:
Here's some more questions I have after another reading:
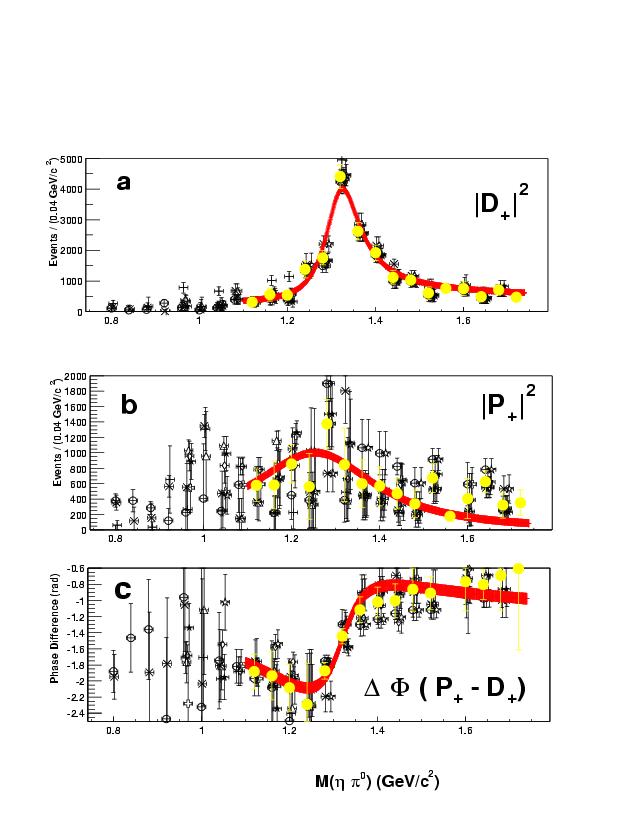
Are the phase variations in Fig. 3c and Fig 4c consistent
with each other? One of these must be mislabelled since both are
labeled P+-D+ but one shows increasing relative phase and one shows
decreasing relative phase. Can we see these overlaid?
Response
Fig.3c and Fig.4c are doen as phase (P+ - D+).
Is the phase variation consistent with the eta pi- data?
(Should it be? I think so...). Can we see the eta pizero and the eta
pi minus phase variations with mass overlaid?
Response
We have no a table of EtaPi- results. So you can see only figures.
Here are Fig.EtaPi- and Fig.EtaPi0 . The difference betwen minimum and maximum of relative phase is Delta=|1.4-0.2|=1.2 for EtaPi- and Delta=|-0.8-(-2.0)|=1.2 for EtaPi0.
I believe the points with error bars in fig. 4 should be
identical to the points with error bars in Fig. 3. Are they? (It's
not obvious that they are.)
Neal
Response
Corrected
*******************************************