E852 experiment
Analysis of Eta Pi0
system with the decay Eta -> Pi+ Pi- Pi0
********************************************
Draft 4
Date:
3 Apr 2006
From: Gary Adams
Some comments on draft 4 of the eta-pizero paper.
Vladimir:
The trc is pleased to note the additional work you have done in draft 4. A
number of technical questions have been cleared up but we still have a few
more that need to be answered. We would like to do this before we start any
discussion of the presentation and conclusions in the paper. Also, please
read John Dowd's comments from his last email.
Response
Response to John Dowd's comments see in John Daud (comments) on draft 4.
1) Fig.1b is very useful but the reader can easily interpret it wrong
because it makes the f0(980) look rather large. Perhaps you could add
another histogram in that box that shows the data after cuts?
Response
a0(980) contribution in EtaPi0 is rather large. Ratio a0/a2 is about 0.5 as a ratio of two bumps in Fig.1b. This ratio is also large ( a0/a2 = 0.6) in Dzierba's paper (Phys.Rev D67) in Fig.2a.
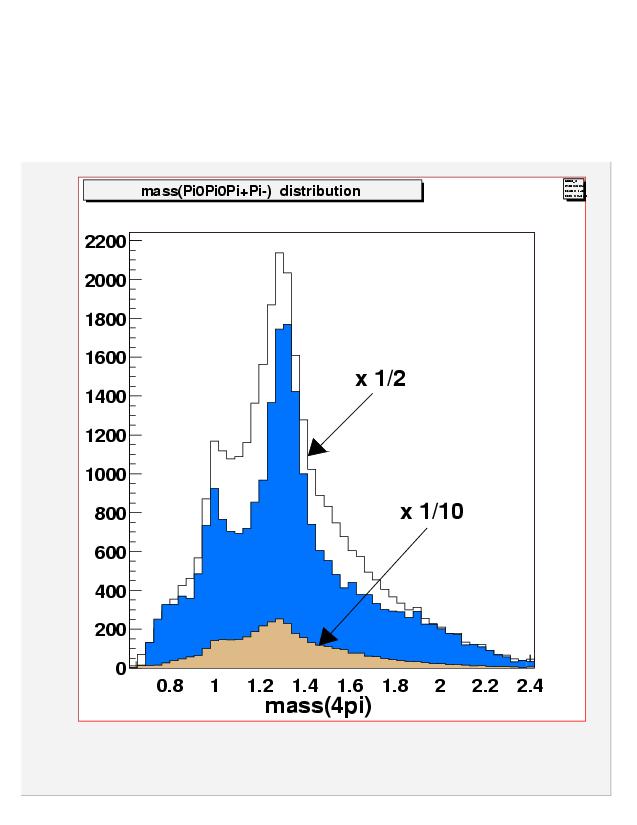
Let's consider 4pi mass distributions after mass cut m(Pi-Pi+Pi0) < 0.65 GeV. You can see in Fig. 4pi mass distribution before kinematical fit (a histogram *1/2) and after kinematical fit on hypothesis EtaPi0 (black histogram of m(EtaPi0)). Lower histogram ( *1/10) is a difference of two first histograms multiplied by 1/10. This is background which is removed by cut cl > 0.01.
The ratio a0/a2 is decreased from 0.6 to 0.5, but they are very close in the limits of statistic errors. We made additional cut cl > 0.01 in our draft of paper in Fig.1b, but ratio is about 0.5.
2) Fig. 2 is not essential to the paper. In view of the question Suh-Urk
had about the unnatural parity assumption you may want to remove it. It is
your choice.
Response
Done. We agree that Fig. 2 is not essential to the paper.
3) The statistical errors in table 1 are very small. We think this may be
due to your use of "average" error bars on each point. Since the
statistical and systematic errors are not independent due to the ambiguous
solutions perhaps an easy way out of this would be to combine them into a
single error bar on each parameter.
Response
We used "average error matrix" in MDF.
Such approach, when we use average solutions and average error matrix is more
consistent and logical.
The systematic errors take into account the large spread of solutions by
chosen many randomly combinations of ambiguous solutions in each mass bin.
For each set of solutions we take its own error matrix .
These errors are very large.
Such description of our analysis is more correct.
4) The upper error bar on P+ mass is only 4MeV in table 2. Please check this.
Response
Corrected
5) The data points in fig. 3 appear to be different from those in fig. 4,
but the text says they should be the same.
Response
Corrected
6) It would be nice to see a comparison of the etapi0 phase with
the etapi-
phase on the same plot, along with the final fit results. This is NOT for
the paper but it may give us a better idea how the statistics affect the
answers.
Response
We have no a table of EtaPi- results. So you can see only figures.
Here are Fig.EtaPi- and Fig.EtaPi0 . The difference betwen minimum and maximum of relative phase is Delta=|1.4-0.2|=1.2 for EtaPi- and Delta=|-0.8-(-2.0)|=1.2 for EtaPi0.
7) Why have you picked the results in table 1 to quote as the final result?
The paper appears to present table 1 and table 2 as equally valid models.
Are we missing something?
Response
The results in table 1 is quoted as the final result at mass(EtaPi0) > 1.1 GeV. In this region of mass we exclude
remaining contribution of Omega decay in maximal degree.