E852 experiment
Analysis of Eta Pi0
system with the decay Eta -> Pi+ Pi- Pi0
********************************************
Date:
Wed, 16 Nov 2005
From: TRC and Gary
*******************************************
Vladimir:
The trc discussed your draft 3 and identified a few things that we would
like addressed.? Some of them require some additional analysis.? We are
aware of how difficult it is for you to do additional work on this but we
think that this research is very important and we would like to see it get
into print.? Here are the questions we addressed:
Response
We are gratefull for the comments of TRC on darft3.
See, please, draft4. We suppose that many questions are responsed in draft4 of paper, which
you can see in web site http://lav01.sinp.msu.ru/~vlk/E852etapiz.html
TRC on draft3 and responses
(comments)
1) Is the method for sideband usage adequate?
Fixing the background based on the sidebands is a reasonable approach, but
the assumption that it is isotropic needs to be demonstrated. From the
scatter plot it looks like much of it should be associated with omegas so
isotropy may not be a good assumption.? Please show us the thetaGJ and Phi
histograms for the sideband data.
Response
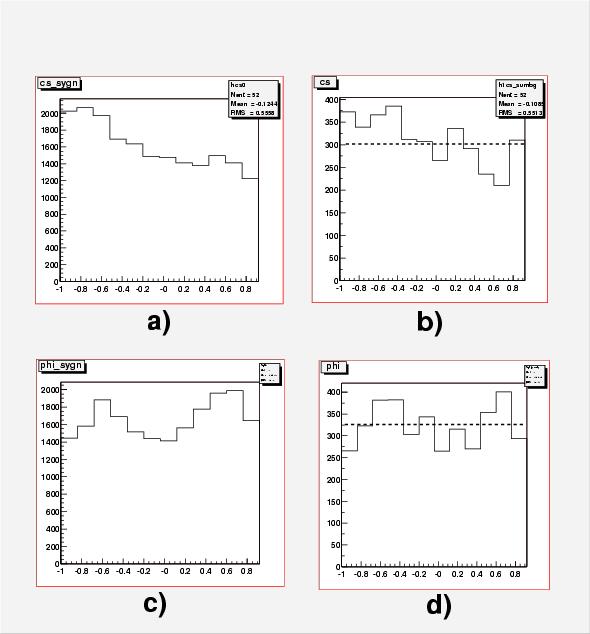
Here is figures which show the degree of anisotropy of thetaGJ and Phi
histograms for the sideband data.
(jpg-file)
Here are the acceptance corrected angular thetaGJ and Phi distributions in mass region 1.14-1.42 GeV. (See note 1, Fig18).
a), c) for signal and b), d) for side bands.
Our conclusion. The deflections from average value (dotted line is isotropic) are 25 % and 15 %
for thetaGJ and Phi distributions in our background.
2) Do we understand why binning matters so much in the PWA?
We do not understand this.? We do not feel that the different PWA results
in tables I and II can stand as they are. They do not agree and the paper
does not explain why. If it is just due to binning then why should we trust
either answer for the pi1 width?? Perhaps an investigation of the
systematic errors in the different t bins would come out large and the two
tables would then agree, but even if that were true it does not yield a
useful result.? We are inclined to trust the PWA result in table I and not
use the result for different t bins.
This was mentioned before, but I do not see how it can be a significant
effect. If the curves are properly averaged within a bin, the accuracy for
a peak that is at least several bins wide should be almost the same.
Also, the statistical errors on the resonance fits PWA+MDF come out very
small for three of the four parameters (table I).? Looking at the error
bars in fig 4 it seems that the errors on mass and width should be
bigger.? Please show us the likelihood scans for those parameters.
Response
We decide not to include the study with binning and for two t' intervals
because we have understood that the difference between "100-MeV bins" data
and "40-MeV bins" is not due to different bin sizes. This hypothesis was
tested by Monte Carlo simulation of a simple artifical example (not shown),
taking into account resolutions effects and gives small enlargement for "100 MeV bin" case. It doesn't reproduce the difference of our case.
The reason of the large difference is the different
conditions in which the fits were done.
Below we discuss the fit with average solutions.
The "40MeV bin" fit
was obtained in whole t-region and mass range > 1.1 GeV.
It is impossible to do the fit in the region mass > 1.1 GeV with
mass bin 100 MeV where are only 6 points. So in draft3
all fits with "100 MeV bin" were done in the whole mass region
(0.78-1.74) MeV.
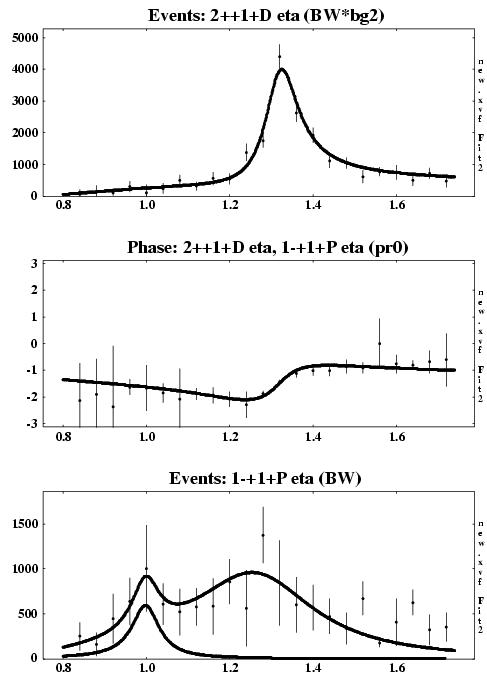
To test this assumption we compared the "40 MeV bin" fit
(Fig.9, Note 2)
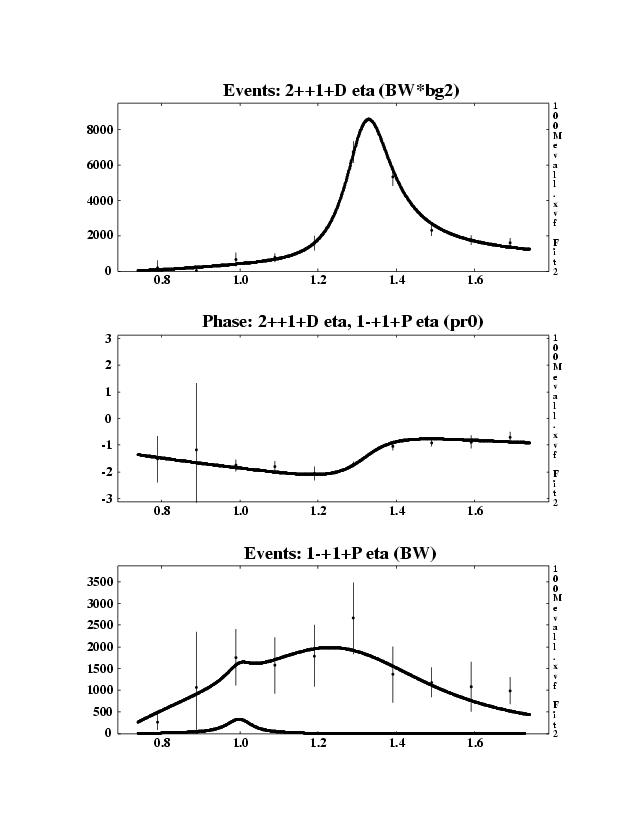
with "100 MeV bin" fit
(Fig. for all t' as in Fig.4 of draft3)
in whole mass
and obtained the results, consisting in statistical errors limits.
40 Mev, M2=1273 +/- 17, G2=412 +/- 57, Table 1, coulomb 4, Note 2
100 Mev, M2=1286 +/- 40, G2=585 +/- 92, Table 4, coulomb 1, Note 2
As for the systematic errors regions (determined by ambiguous solutions)
they overlap so deeply that speaking about the difference
between "40 and 100 Mev bin" results isn't correct.
This is once more reason not include two t' intervals data in the article.
In draf4 we confine ourself to 40 MeV mass bin and pay more attention to MDPWA.
3) Is the method for the MDPWA adequate?
We agree that this is a very interesting method and we would like to see
the new MDPWA results for different t bins put into the paper instead of
the PWA results in table II. The new fits in note 3 are very helpful. Also,
we feel that the assumptions in the MDPWA have not been justified or
adequately studied. Why is leakage included only in positive reflectivity
P+ and not P- or P0? The assumed wave shapes for P0, and P- seem arbitrary,
and yet the fitted strength for P- is large. How do we know this is not due
to the pi1? We need to see a fit that assumes resonance shapes, even if
additional background parameters are needed to get a good fit. We also do
not like the fact that the negative reflectivity wave intensities are fixed
in the fit by iteration.? The last step should be a fit that converges on
all parameters.? Perhaps you need to use a smaller step size?
Response
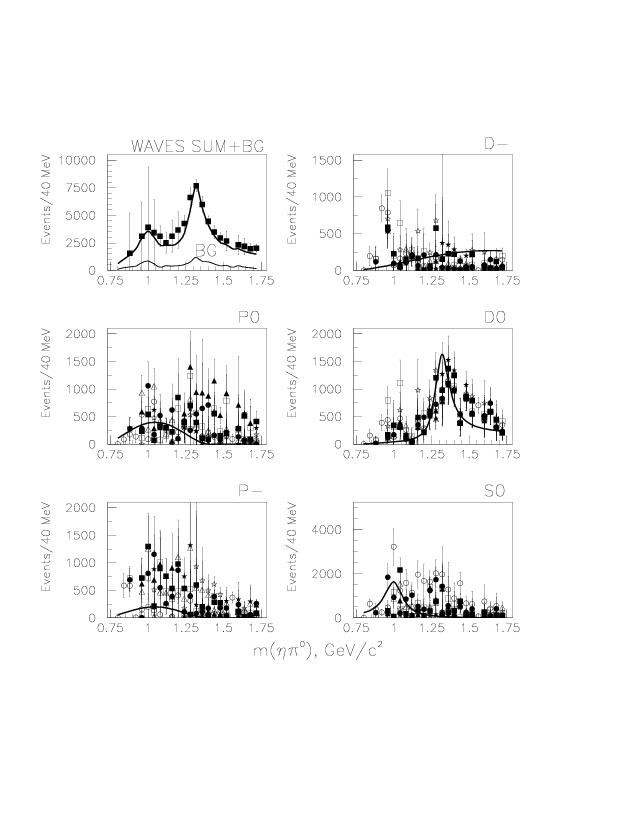
We study MDPWA more thoroughnessly. See Note 5 "MDPWA, all parameters are free", which describes five selected fits.
Now we made many fits with all parameters free and include in darft4 the description of method and its results.
In many fits we were forced to fix a2(1320) resonant parameters in order to have a stable fit. Only Fit1 with the polynomial intensity of P0, P-, D0, D- have absolutely all free parameters.
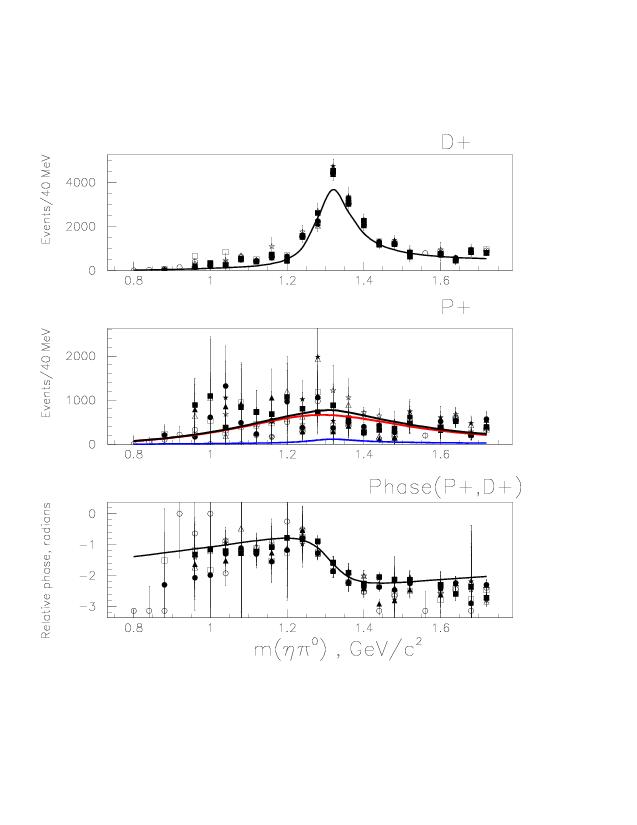
Fit2 of MDPWA, where P-, P0 have BW shape with mass and width as in P+ wave and D0, D- as D+ wave, is not satisfied. The spread of UNPWs ambiguous solutions is so large, that the fit is satisfied by any form of mass dependence. So a minimums of likelihood function are close in all fits. We select Fit3 for demonstrate in draft4 as a fit with the most lower likelihood value as the best fit.
(D+ and P+ waves)
(other waves).
Here P+ intensity (black line) is a sum of BW bump (red line) and leakage of D+(blue line).
Other MDPWA fits allows us to estimate the systematic errors.
Good news is rather stable parameter of Pi1 near 1270 Mev in each fit and very similar relative phase (P+ - D+) behaviors.
Bad news is rather large Pi1 width in MDPWA in limits 300-700 MeV.
Also, the PWA fits show a big a0(980) but your MDPWA result shows small
strength in S0.? Shouldn't there be a big tail from a0(980)?? Why didn't
you extend the fits to lower mass?? Note that the IU paper includes the a0
so that is part of the comparison that we should be making.
Response
We extend the mass region and include a0(980) in our MDPWA fits. We found its parameters mass=0.9975 GeV , width=0.1022 GeV and fixed them. But we pay your attention that the region mass < 1.1 in our case is not good because of some contribution of Omega decay. So we take the results of MDF of average solutions in mass region > 1.1 GeV as the final resonant parameters (Table 1, draft4)
4) How should one estimate sys errors in the MDPWA?
As you and Suh Urk previously pointed out, this is essential.
We don't have
much insight to offer, but two items that should be included are variation
of the answer with a) inclusion of leakage, and b) using different wave
shapes for P0 and P-.? My preference would be to use the present fit as a
test of sensitivity for negative reflectivity assumptions, using a new fit
with resonance shapes as the "correct" choice.? Perhaps you can think of
other important sources?
Response
We investigated a lot of efforts to estimate the
systematic error region. It is determined by the limiting
cases consideration:
a) switch on (off) the leakage
b) different wave shapes for UNPW.
c) fixed and free some parameters of MDPWA
As you can see in draft4, table 2, the obtained regions are the following:
D_+ Mass = 1314 +- 3 ^{+13}_{-10} | Width = 112 +- 5 ^{+45}_{-18}
P_+ Mass = 1286 +- 11^{+4}_{-80} | Width = 532 +- 46 ^{+190}_{-213}
The systematic errors of MDPWA have the different origins then that of
PWA+MDF, but they are the same order of magnitude.
*******************************************
*******************************************
*******************************************
*******************************************